

Apple Watch and Oura Ring turn the gaps between heartbeats into insights about stress and recovery. Here’s what HRV measures, how the devices differ, and why your own long-term trends matter more than a single score.
***
Editor’s note: A version of this article by 叁思Santh appears on December 2, 2025 on SSPAI with the title “被量化的心跳:HRV 是身体的晴雨表,还是制造焦虑的数字游戏?”. Translated and published by agreement.
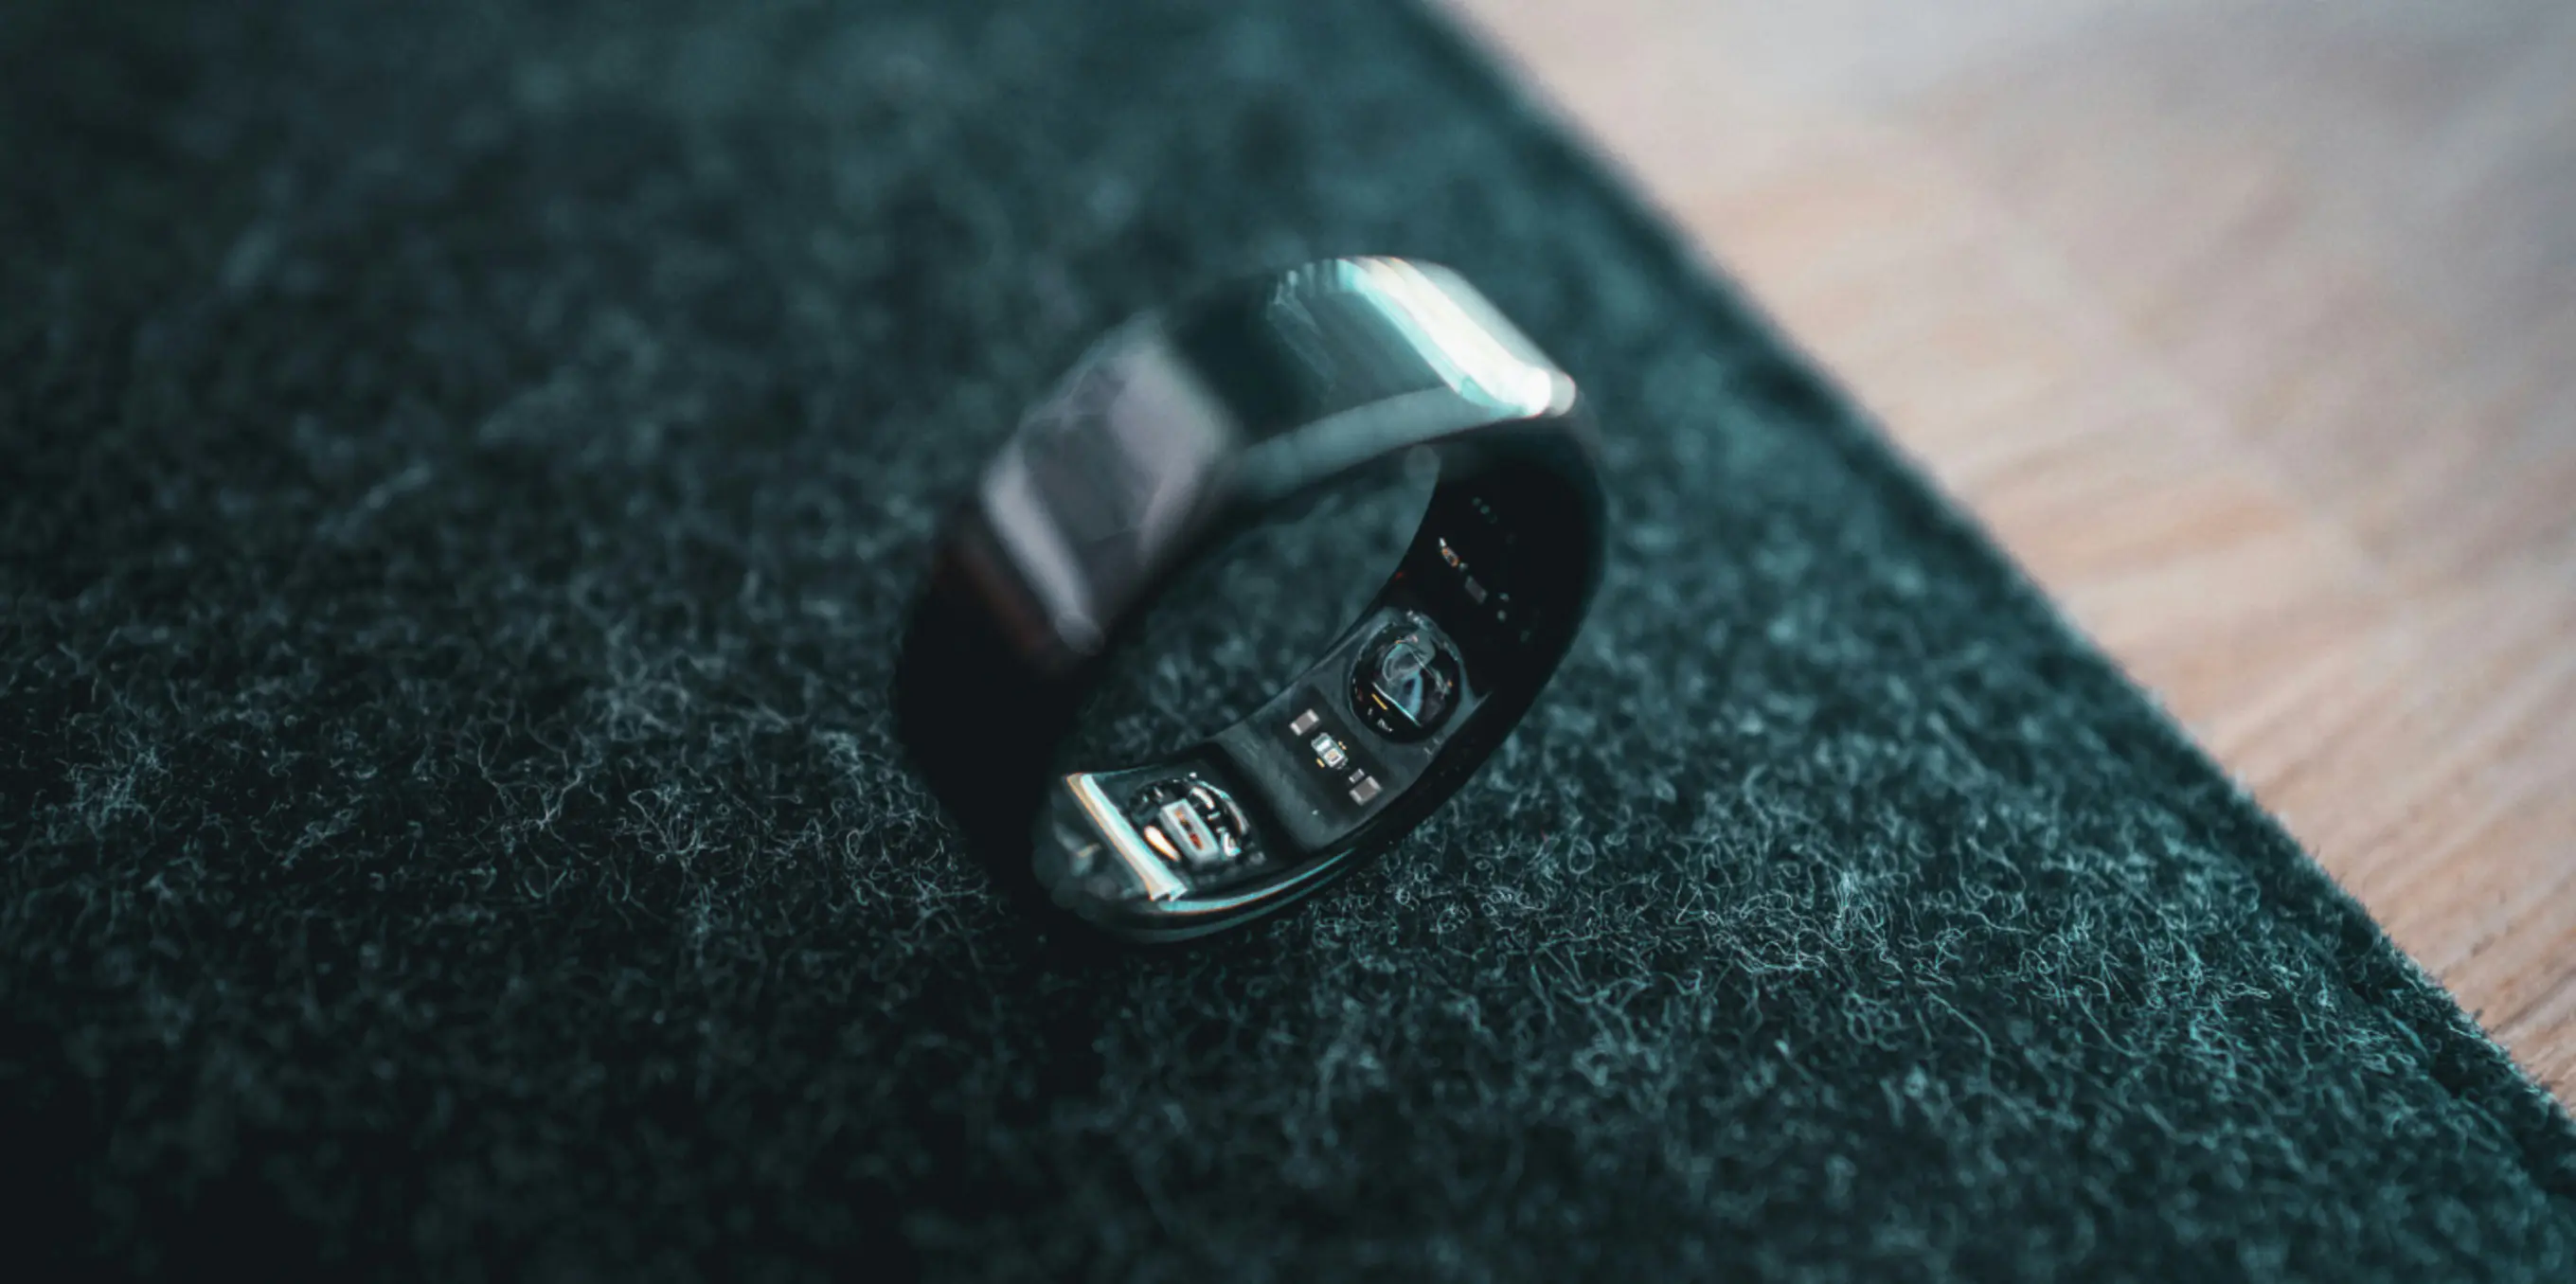
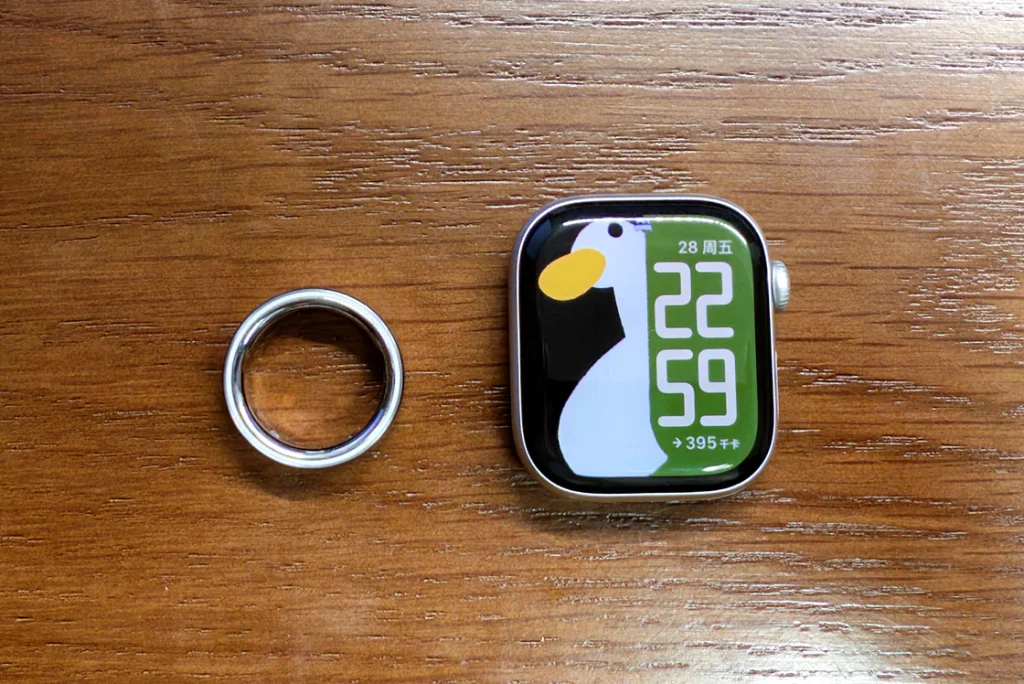
As a medical student and a tech enthusiast, I’ve long used an Apple Watch to track my everyday health metrics, regularly adding readings such as blood pressure and blood glucose to the Health app. Recently, on a close friend’s recommendation, I bought an Oura Ring, intending to use it in place of my Apple Watch to monitor my vital signs. After switching devices, I noticed that both tracked an important metric: heart rate variability, or HRV. Oura uses it to assess daily stress, recovery and sleep quality; Apple Watch lists it in the Health app as one of its key heart health metrics.
This wasn’t my first encounter with HRV. Over the past couple of years, a growing number of apps have built their features around it: StressWatch and Amood for stress monitoring, for example, and PeakWatch and Athlytic for exercise recovery. Even specialist sports technology brands such as Garmin have begun incorporating HRV into their Training Readiness assessments.
That left me with a few questions. What exactly is HRV? Can it really do everything people claim? How accurate are the measurements? Can the watches, fitness bands and rings we wear every day actually produce reliable readings?
I went through some background material and research papers to find out. This article brings together what I found, in the hope that it will be useful to fellow readers.
(Disclosure: I paid for both devices myself. This is not an advertisement. Oura Ring isn’t even sold in China. And it comes with a US$5.99 monthly subscription. Not impressed.)
The counterintuitive nature of HRV
What comes to mind when you think of a heartbeat? Perhaps a flashing red heart icon, pulsing at a steady rhythm, or the orderly waveform of an electrocardiogram. If your resting heart rate is 60 beats per minute, surely your heart should beat exactly once every second, like a precision metronome. That seems the most intuitive picture of a healthy heartbeat.
For a long time, much of the medical profession thought so too. Before the mid-20th century, many doctors regarded a steady, regular heartbeat as a sign of health. Fluctuations in the intervals between beats might suggest something was wrong. Yet as medicine advanced, particularly with the introduction of computers in the 1960s and 1970s, researchers made a surprising discovery: healthy hearts do not beat at perfectly regular intervals.
Only a dying or severely damaged heart beats with the precision of a metronome.
In 1965, while monitoring foetal heartbeats at Yale University, Hon and Lee noticed something counterintuitive. In foetuses approaching distress or even death, the heartbeat became unusually ‘regular’: the tiny fluctuations in the intervals between beats diminished markedly or disappeared altogether. In the 1980s, a more rigorous and better-known large-scale study of 808 patients who had suffered a myocardial infarction found that mortality was much higher among those with lower heart rate variability than among those with higher variability.
Researchers began to realise that this ‘irregularity’ was not necessarily a problem. It could be a sign of vitality. A heart locked into an unchanging rhythm was like a machine that had lost its responsiveness: it could no longer adapt to external stimuli. Changes in heart rhythm were not simply random. They followed patterns that could be quantified and predicted. These apparently chaotic fluctuations held clues to the body’s condition.
The measure used to quantify them became known as heart rate variability: HRV.
What is HRV?
Heart rate variability describes the small fluctuations in the time intervals between successive heartbeats. It measures changes in the gap between one beat and the next—the RR interval—rather than the number of beats per minute, which is your heart rate. Measure these intervals carefully on an electrocardiogram, and you might see something like this:
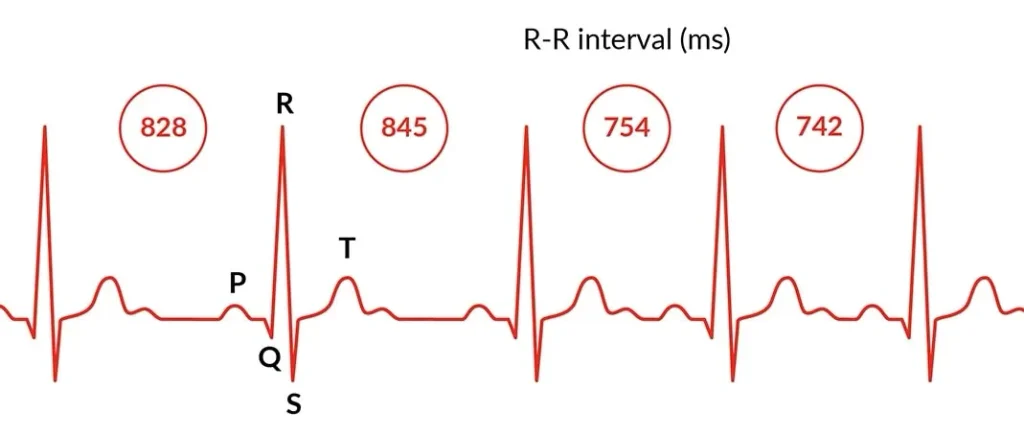
- Beat 1 to beat 2: 828 milliseconds
- Beat 2 to beat 3: 845 milliseconds
- Beat 3 to beat 4: 754 milliseconds
- Beat 4 to beat 5: 742 milliseconds
- And so on.
If these intervals vary considerably, HRV is high. If they are almost identical, HRV is low. The measure primarily reflects how the autonomic nervous system—its sympathetic and parasympathetic branches—regulates the heart.
The sympathetic nervous system:
- Acts as the accelerator. It becomes active when the body encounters stress or fear, or needs to mount a ‘fight or flight’ response.
- Speeds up the heart, increases the force of its contractions and mobilises energy to deal with an emergency.
- Lowers HRV when activated.
The parasympathetic nervous system:
- Acts as the brake, working mainly through the vagus nerve.
- Handles ‘rest and digest’ functions, such as promoting energy storage, slowing the heart and reducing the force of its contractions.
- Raises HRV when activated.
As you breathe in, sympathetic activity increases slightly and your heart speeds up. As you breathe out, the parasympathetic system takes the lead and your heart slows down. This breathing-related fluctuation in heart rate is called respiratory sinus arrhythmia, and it is an important component of HRV. A healthy autonomic nervous system should be adaptable: able to respond quickly when a challenge calls for action, and to settle down just as quickly when it is time to relax. That ability to move between activity and rest is reflected in HRV.

How HRV is measured and calculated
How do we turn those changing intervals into a single HRV value?
First, a recording device needs to capture the precise timing of every heartbeat. The medical gold standard is the electrocardiogram, or ECG, which records the electrical signals generated by the heart as it beats. Each beat produces a sharp peak called an R wave. The time between two successive R waves is the RR interval we want to measure. Relatively portable ECG devices can also be worn for 24 hours, providing a continuous day-long recording.
Consumer devices use a different technique: photoplethysmography (PPG). That green LED on your wrist estimates your heartbeat by detecting changes in light absorption as blood flows through the tissue. Each time your heart beats, a pulse of blood reaches your wrist, slightly changing how much of the LED’s light is absorbed. By detecting these changes, the device can estimate the timing of each beat and record the intervals between them.
Once that sequence of intervals has been collected, abnormal beats, missed beats and artefacts must first be identified to obtain normal-to-normal intervals suitable for analysis. Different algorithms can then turn those intervals into different HRV values.
There are three main approaches: time-domain analysis, frequency-domain analysis and non-linear analysis.
| Time-domain analysis | Frequency-domain analysis | Non-linear analysis | |
|---|---|---|---|
| Basic approach | Uses statistics such as means and standard deviations to describe the extent of variation over time. | Breaks the signal down into different frequencies to examine the balance of faster and slower oscillations. | Explores chaos, complexity and unpredictability in the data. |
| Main question | How much variation is there? | How fast does the variation occur? | How complex is the pattern of variation? |
| Common measures | SDNN, RMSSD, pNN50 | LF, HF, LF/HF | Poincaré plots, SD1/SD2, entropy |
| Strengths | Simple, intuitive calculations; relatively modest demands on data quality; useful for observing overall trends. | Can distinguish underlying physiological mechanisms, such as sympathetic and vagal activity. | Adds information about patterns of variability, though their physiological and clinical interpretation still requires validation. |
| Limitations | Cannot distinguish the causes of variation—for example, whether a change comes from stress or relaxation. | Requires a stationary, continuous signal, without gaps or artefacts. | Complex calculations; requires sufficient data; results are abstract and difficult to interpret. |
Readers with some knowledge of data science will recognise that non-linear analysis is highly abstract, with complex calculations and interpretations. Its algorithms are not yet mature, and it is used more for exploratory research than practical applications.
Frequency-domain analysis places high demands on accuracy and continuity, while PPG is easily disrupted. Arm movements, poor sensor contact, skin pigmentation, tattoos and temperature changes can all affect measurement accuracy. These disturbances can distort the resulting frequency spectrum so thoroughly that it becomes meaningless. The interpretation of LF and HF values also remains a subject of academic debate.
That is why consumer products—smartwatches, fitness bands and rings—mostly use time-domain analysis. The calculations are straightforward, and the results are easy to understand. The two most common measures are SDNN and RMSSD.
As it happens, my two devices use precisely these two different measures: SDNN on Apple Watch Series 10 and RMSSD on Oura Ring 4. So what is the difference?
SDNN and RMSSD
SDNN: standard deviation of normal-to-normal intervals
SDNN is one of the longest-established HRV measures. It was used in the study of 808 heart attack patients mentioned earlier. The calculation is straightforward: take the standard deviation of all the normal-to-normal heartbeat intervals.
For a simple example, take five intervals of 950, 1,030, 980, 1,040 and 960 milliseconds. In practice, measurements generally require 24 hours, or at least five minutes, of data. The mean of our five intervals is 992 milliseconds. Following the sample standard deviation formula, square each interval’s difference from the mean, add the results, divide by N − 1 and take the square root. The resulting SDNN is approximately 41 milliseconds.
Extensive research has established close associations between SDNN and a range of heart conditions, including coronary heart disease, atrial fibrillation, myocardial ischaemia and heart failure. In prognostic research, it is also regarded as a reliable predictor of cardiovascular mortality—death from cardiovascular disease—and all-cause mortality.
But SDNN has a clear limitation: changes in heart rate itself can affect the result. Imagine getting out of bed and starting to exercise, with your heart rate rising from 60 to 100 beats per minute over five minutes. Even if the intervals at any given heart rate are very regular, with little variability, the overall shift in the mean can push SDNN substantially higher. A faster heart rate, after all, means shorter intervals between beats.
SDNN is therefore better suited to reflecting overall variation across a period than to describing a momentary state. Older Apple Watch models take periodic samples, each lasting about a minute, and record the results. Daily, weekly and monthly averages of those samples are then presented as trends: a reference for heart health over time, rather than a precise assessment from a single reading.
RMSSD: root mean square of successive differences
RMSSD works differently. The crucial word is ‘successive’. Rather than looking at the overall distribution of intervals, it focuses on the differences between adjacent intervals.
Using the same data, we calculate the differences: 1,030 − 950, 980 − 1,030, 1,040 − 980 and 960 − 1,040. That gives us 80, −50, 60 and −80 milliseconds. Square those differences, take their mean and then take the square root. The resulting RMSSD is approximately 69 milliseconds.
Because it considers only successive differences, RMSSD is largely unaffected by trends in heart rate. Its particular appeal is that it can reflect parasympathetic activity, especially activation of the vagus nerve. Physiologically, parasympathetic signals act very quickly—within milliseconds—and can slow the heart almost immediately. Sympathetic signalling relies on chemical transmission and responds more slowly, over seconds. Rapid fluctuations between successive heartbeats therefore reflect parasympathetic activity, and RMSSD is well suited to capturing these high-frequency changes.
A higher RMSSD indicates greater parasympathetic activity and a more relaxed body. Oura, with its emphasis on sleep tracking, samples more frequently and records data throughout the night. Look closely and you may notice that the ring’s green LED is on almost continuously while you sleep. When you wake up, you get a weighted average of the night’s RMSSD readings, providing an important reference for sleep quality and recovery.
Apple Watch also records raw heartbeat data. Many third-party apps, including Athlytic and PeakWatch, use these data to calculate RMSSD and provide recovery scores similar to Oura’s. The latest Apple Watch Series 12 and Ultra 4 have new optical and electrical heart sensors, increasing the frequency of background heart rate readings by a factor of 60 and HRV measurements by a factor of 24 compared with older models. This has also enabled the Health app to add Recovery HRV, a measure calculated using RMSSD that requires more frequent data collection.
A consumer’s guide to HRV
Most people like you and me are less interested in how HRV is calculated than in two practical questions:
- What can HRV actually tell us about our health and physiology, and how strong is the evidence?
- How accurate are HRV measurements from Apple Watch, Oura Ring and other mainstream wearables, and how do they compare with medical-grade equipment?
What HRV can tell us
Research describes HRV as a sensitive but non-specific biomarker. Put simply, it can tell you that something is wrong, but it cannot tell you exactly what.
Monitoring disease and spotting early warning signs
The strongest evidence so far comes from disease monitoring. A 2022 meta-analysis found that people in the lowest quartile for HRV had 1.56 times the risk of all-cause mortality compared with the rest of the population studied. Another meta-analysis, involving people without cardiovascular disease, associated lower HRV with a 32–45% increase in the risk of a first cardiovascular event. Each 1% increase in SDNN was associated with an approximately 1% reduction in the risk of fatal or non-fatal cardiovascular disease.
In mental health research, studies consistently find significantly lower HRV in people with depression, anxiety, bipolar disorder and schizophrenia. HRV biofeedback training—monitoring HRV in real time and adjusting breathing to bring it into a favourable state—has been shown to significantly improve symptoms of anxiety and depression, although its long-term clinical effects need further research.
A meta-analysis based on smart wearable data also found reductions in both SDNN and RMSSD among people with COVID-19, of approximately 3.25 and 1.24 milliseconds respectively.
Feedback on training and lifestyle
Several controlled studies suggest that HRV-guided training can improve exercise performance and training outcomes while reducing discomfort. The approach adjusts training according to each morning’s HRV: high-intensity sessions when HRV is at or above baseline, and low-intensity exercise or rest when it falls well below baseline. However, existing studies generally have small samples and vary considerably in their methods. There is no standardised approach yet.
When it comes to lifestyle, alcohol strongly suppresses parasympathetic activity. Even a small amount in the evening can significantly lower HRV during that night’s sleep. Late-night eating, insomnia and irregular sleep schedules can also show up directly in the next day’s HRV. The association between chronic insomnia and HRV, however, remains inconsistent.
So if you wake one morning to find that your HRV has dropped, it does indicate some form of physiological stress. You might have stayed up late, had a drink or pushed a little too hard at the gym the day before. You might also be coming down with a cold, experiencing a heart problem or having fluctuations in blood glucose, among other possibilities.
HRV cannot diagnose a particular disease on its own, but it is a valuable tool for tracking health over time. Its main value lies in establishing a personal baseline, then watching for trends away from that baseline to guide lifestyle adjustments. Consistent tracking can be useful for people seeking to improve their health, spot early warning signs or take a more evidence-based approach to training.
I am much more sceptical about using short-term fluctuations or a fixed threshold—a value above or below a particular number—to assess stress or diagnose disease. There is currently insufficient evidence or guidance to support doing so.
How accurate are consumer wearables?
Most of the research discussed earlier measured HRV using an ECG. This is the medical gold standard for measuring and calculating HRV: electrodes on the skin directly capture the electrical signals produced by the heart’s depolarisation, with very high precision and strong resistance to interference.
Almost all consumer devices instead use the PPG technology described earlier. Strictly speaking, this optical method measures pulse rate variability, or PRV: the intervals between pulse waves produced by changes in blood volume, rather than heart rate variability itself. A pulse wave takes time to travel from the heart to a peripheral sensor, and that transit time is affected by blood pressure, arterial stiffness and age. This creates a fundamental difference between PRV and HRV. PPG is also more vulnerable to interference and highly dependent on measurement conditions.
The good news is that during sleep or at rest, agreement between PPG and ECG can be excellent, with correlation coefficients ranging from 0.91 to 0.999—the closer to 1, the better. A 2025 study validated overnight resting heart rate and HRV measurements from several consumer wearables, ranking them as follows:
Oura Ring 4 > Oura Ring Gen3 ≈ WHOOP 4.0 ≈ Garmin fēnix 6 > Polar Grit X Pro.

In the chart, MAPE (%) means mean absolute percentage error, where lower is better. CCC is the concordance correlation coefficient, where a value closer to 1 is better. Rings outperformed watches and wristbands in this study, possibly because fingers have a denser network of blood vessels, rings fit more closely and movement causes less interference.
In 2026, Apple also published a benchmarking study of its new heart rate sensing system. Conducted by Apple itself, the study tested Series 12, with 1,254 participants included in at least one paired comparison. The results supported its claim of better heart rate measurement accuracy than every other device included in the comparison, as shown in the chart. However, the endpoint was error in beats per minute, not error in SDNN or RMSSD measured in milliseconds. The findings therefore address the accuracy of the optical heart rate sensing system itself.
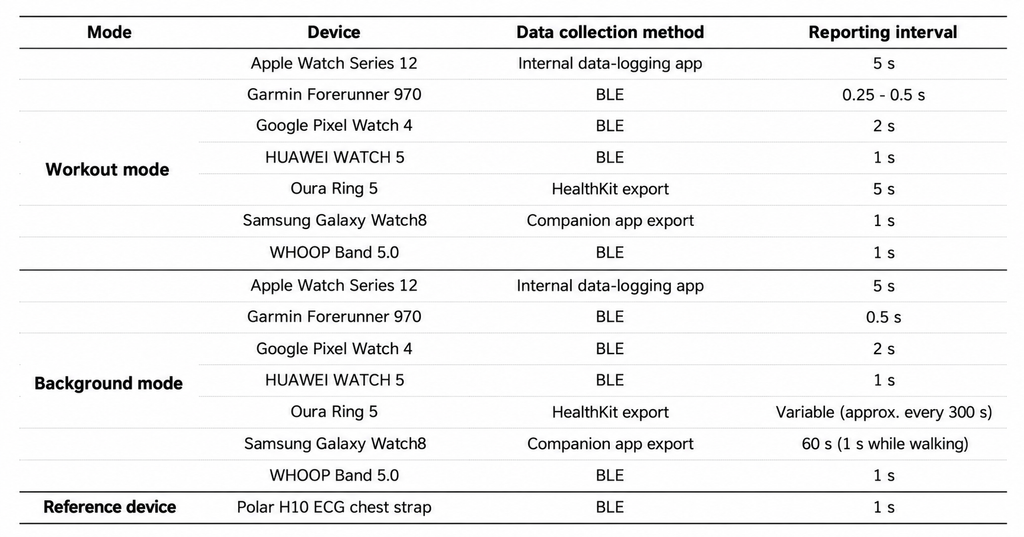
As exercise intensity rises, however, accuracy falls across all devices. Poor contact with the skin, muscle contractions, sweat and changes in blood flow can all interfere with PPG signal quality.
Other factors matter too. Because melanin absorbs light, particularly green light, measurement errors are generally greater in people with darker skin. Manufacturers use techniques such as different wavelengths, adaptive optical paths and brightness adjustments to improve readings.
As an aside, if you have an Apple Watch older than Series 12 or Ultra 4, there is a trick for increasing the sampling rate: enabling AFib History makes the watch take denser, continuous RMSSD samples during sleep, rather than sparse SDNN samples. It does, however, put considerably more strain on the battery.
This brings us to an important point: HRV values from different brands cannot be compared directly. Manufacturers use different algorithms, sampling frequencies and data processing methods. The same person can therefore get HRV values that differ by 200–300% across devices. Tracking your own trends on the same device may be the only meaningful comparison.
Making sense of your HRV data
After all that, the practical question is how to use the data properly. Here are the main points I would suggest keeping in mind:
- Establish your own baseline instead of comparing yourself with others. Normal HRV varies between individuals: one person’s ‘low’ may be another person’s ‘high’. Comparisons with other people have limited value; tracking your own changes over time provides more useful information.
- Keep measurement conditions consistent. Use the same device, at the same time of day, in the same position. Readings taken just after waking, or averages across a full night’s sleep, are useful options. Immediately after exercise, after a meal or when emotionally worked up are less suitable times.
- Beware of simplistic interpretations. ‘High HRV is good; low HRV is bad’ is a dangerous oversimplification. An unusually sharp rise could also reflect the body compensating after extreme fatigue, or artefacts caused by an abnormal heart rhythm.
- Understand which measure suits which purpose. Morning RMSSD is more useful as a reference for that day’s training readiness, while SDNN is better suited to tracking longer-term cardiovascular health trends.
Oura Ring was designed around sleep and recovery from the outset. Both its physical design and its algorithms have been extensively optimised for HRV monitoring, with more frequent sampling throughout the night. Its more important advantage, though, lies in how it interprets the data. Rather than simply displaying raw HRV, it combines weighted inputs—including HRV, resting heart rate, body temperature deviations, the previous day’s activity and sleep quality—into a Readiness Score from 0 to 100.
The algorithm emphasises balance and personalisation. For example, it compares current HRV with the user’s weighted average baseline over the preceding 14 days, rather than population norms. That individual comparison is crucial for a measure that varies so widely from person to person. Of course, it also means paying US$5.99 a month on top of the cost of the device.
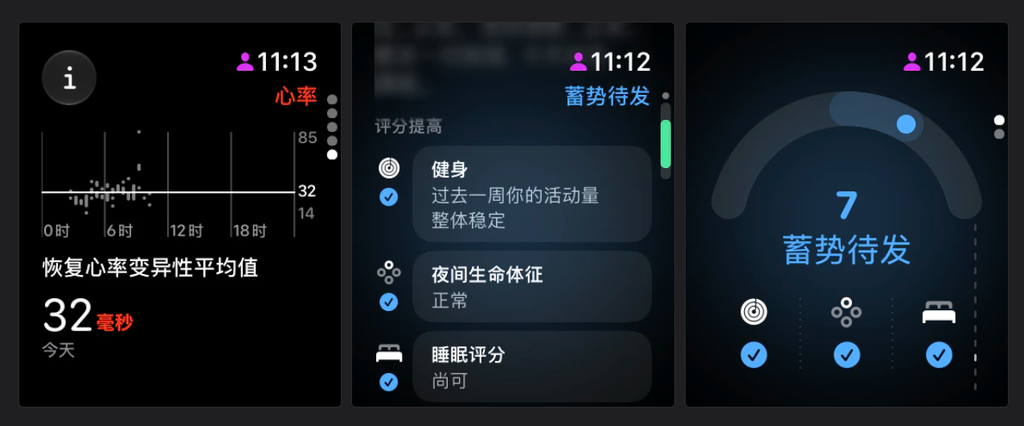
Apple Watch, by contrast, was originally constrained by battery life considerations. It sampled HRV less frequently and recorded the data without interpreting them, leaving more specialised analysis to third-party apps. Series 12 and Ultra 4 introduce new optical heart sensors and higher sampling frequencies, allowing more detailed monitoring of sleep and recovery. Later in 2026, the Health app is also due to gain Readiness, which combines sleep, vital signs and activity data to help wearers understand their condition and plan exercise and rest.
What to take away
HRV measures variation in the intervals between successive heartbeats, rather than how fast your heart is beating. Consumer devices mainly use two measures: SDNN and RMSSD. SDNN is better suited to reflecting long-term cardiovascular health trends; RMSSD is more useful for assessing short-term recovery and parasympathetic activity. The two cannot be compared directly.
HRV is sensitive but non-specific. It can suggest that something is wrong without identifying the cause. Late nights, alcohol, overtraining, the onset of a cold and heart disease can all lower it. The encouraging part is that, during overnight rest, mainstream consumer wearables show strong agreement with medical-grade ECG measurements, with rings outperforming wrist-worn devices.
The best approach is to compare your readings with your own history, keep measurement conditions consistent and focus on long-term trends rather than the ups and downs of individual readings.
A final thought
Our generation may be the first in human history able to ‘see’ our bodies with this degree of precision. The intervals between heartbeats, the cycles of sleep, the ebb and flow of stress: things we could once only sense vaguely have become numbers and curves moving across a screen.
That is both technology’s gift and its temptation.
In recent years, a rather ironic term has emerged: orthosomnia. People become so preoccupied with achieving perfect sleep data that the resulting anxiety makes their insomnia worse. A high score makes them feel refreshed; a low one can instantly convince them they are having an off day, even when they otherwise feel fine. It is an absurd feedback loop: the device bought to monitor stress becomes a source of stress itself.
It brings me back to the counterintuitive finding at the start of this article: only a dying heart beats with the precision of a metronome. Those apparently chaotic fluctuations and variations are part of what makes us alive.
Technology is rational; the body is something we feel. When we become anxious about data and let scores dictate our mood, we impose a rigid way of thinking on a life that should be allowed to move and change.
Data can help us recognise trends and spot anomalies, but they can never replace our direct sense of our own bodies. Being well is not a perfect upward curve in an app. It is putting down your phone, closing your eyes and feeling the strength of your heartbeat and the easy rise and fall of your breath.
The best use of these devices is not to make us more dependent on them, but to help us learn to listen to ourselves again. Then, one morning, we may find we no longer need to check a single number to know that it is going to be a good day.
Update: revisiting the article for Apple Watch Series 12
Updated on 17 October 2026 at 14:58.
In September 2026, Apple Watch Series 12 and Apple Watch Ultra 4 arrived with a new Health Sensing System. More frequent heart rate and HRV measurements enable a broader and more detailed range of health features, with HRV playing a particularly important role. This updated edition incorporates information about the new Apple Watch features and related research, and revises parts of the original article to explain the new capabilities and the principles behind them more clearly.
Edited by 北鸮.
Share: